Predictive modeling of wildfire hazards provides opportunities to prevent significant financial losses and other negative socio-environmental consequences. The need for quantitative risk assessment has led to the development of wildfire simulation approaches that allow predicting the occurrence and development of fires at the landscape level. The successful implementation of such approaches requires proper use of fire simulation software along with the precise characterization of key features of the landscape. There are many options to predict the development of individual fires regarding weather conditions or to investigate the likelihood of a potential risks at given area of the landscape based on simulated fires (eg, FARSITE, FlamMap, BehavePlus).
The wildfire professional community often refers to ignition and burn probabilities as a measure of fire risks. Technically, the ignition probability can be calculated based on the coordinates of historical fires that have occurred in the area over time. The burn probability, however, can be calculated only using simulated outputs of fire spread (Fig. 1).
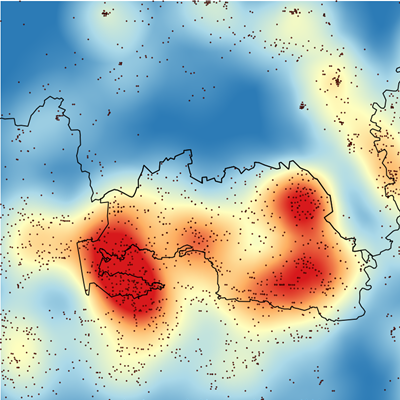
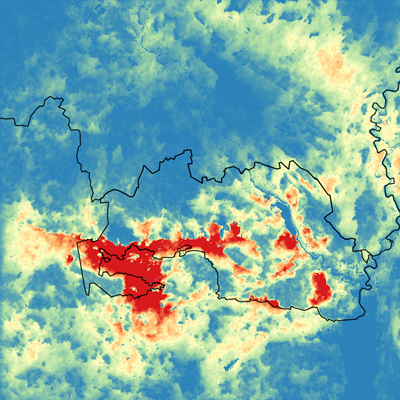
Fig. 1. Ignition probability (left panel, the points represent locations of the historical fires for 1992–2016) and burn probability (right panel) areas contaminated after the accident on the Chornobyl nuclear Plant
The wildfire simulation is based on the spatial distribution of fuels over the territory. The simulation utilizes a surface and crown fire spread model, there are also algorithms that predict the transition of surface fire into the crown fire. According to Anderson (1982) the fuels are classified into 13 standard fire behavior models. A new set (Scott & Burgan, 2005) includes 40 standard fire behavior fuel models that are classified into five fuel types: grass, grass-shrub, shrub, timber litter, and timber understory. The fire simulation is based on landscape file that contains eight layers (Fig. 2):
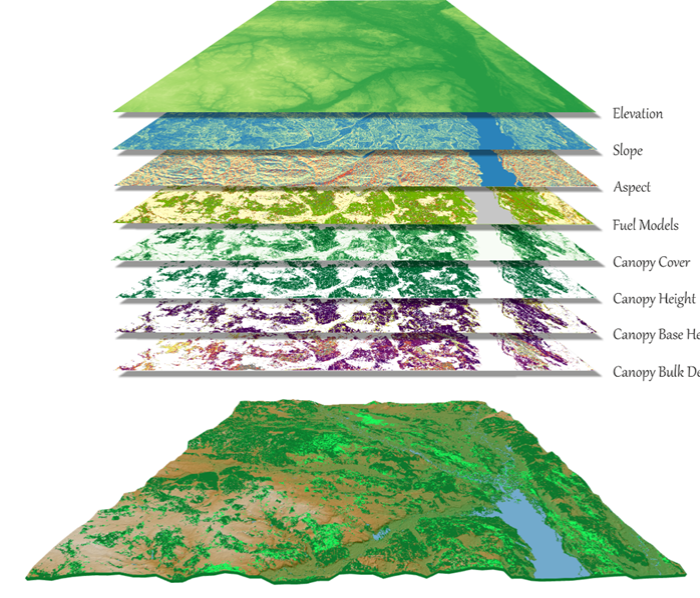
The spatial data set used in wildfire simulation at landscape level
For each fuel model, fire spread depends on fuel load, fuel moisture, and weather scenarios. So, the models need to be tested in terms of realistic fire behavior on the landscape (Fig. 3).
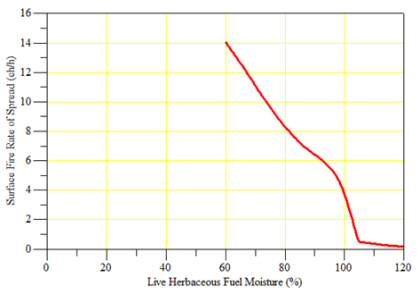
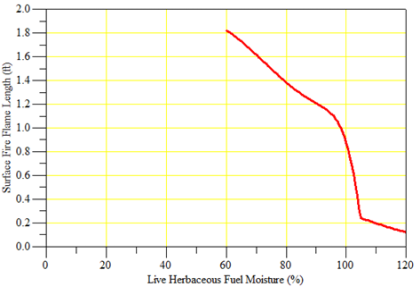
Fig. 3. Evaluation of the potential fire spread (left panel) and flame length (right) for the fuel model GS1 according to the various fuel moisture content using the BahavePlus fire modeling software
Fuel model selection is important to get realistic fire simulation outputs. An adequate fuel type assignment requires a precise replication of the distribution of simulated and historical fire sizes and their shapes (Fig. 4). The effectiveness of crown fires modeling is
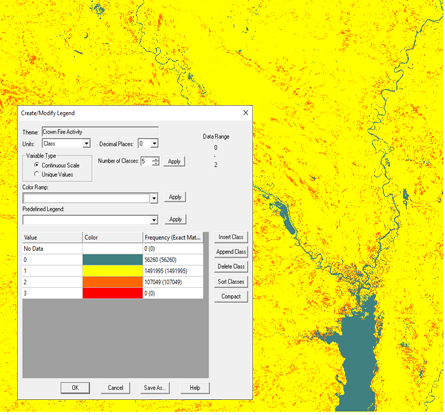
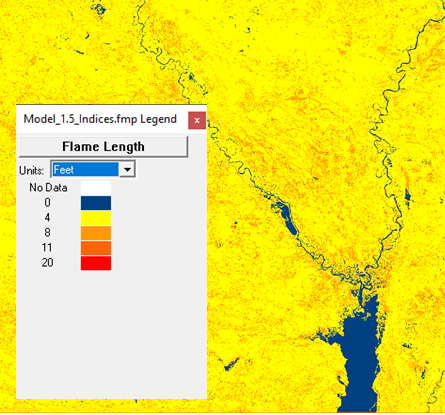
Fig. 4. Fire type (1 – surface fire, 2 – torching, 3 – active crown fire) and flame length simulated using the FlamMap software
The result of the simulation is a burn probability map (see Fig. 1). For a given pixel, the burn probability is calculated as a ratio of the number of times the pixel was burned to the total number of simulated fires. To build a reliable burn probability map, thousands of fires need to be simulated. Their distribution and perimeters must be as realistic as possible (Fig. 5).
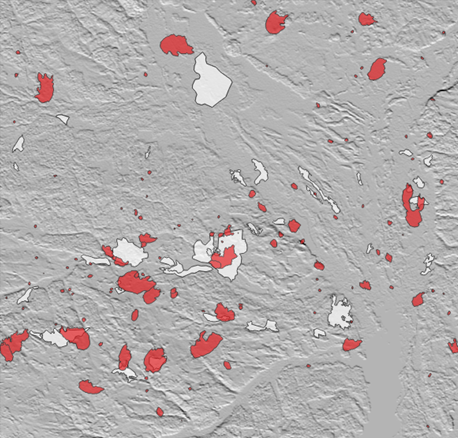
Fig. 5. Historical (white) and selected simulated (red) wildfire perimeters
The wildfire simulation is used to mitigate risks of large fires and provides recommendations to wildfire managers on how the landscapes could be modified to reduce wildfire occurrence and fire spread, fuel treatment, fuel breaks optimization etc.
Details of the modelling are provided in the following publication: